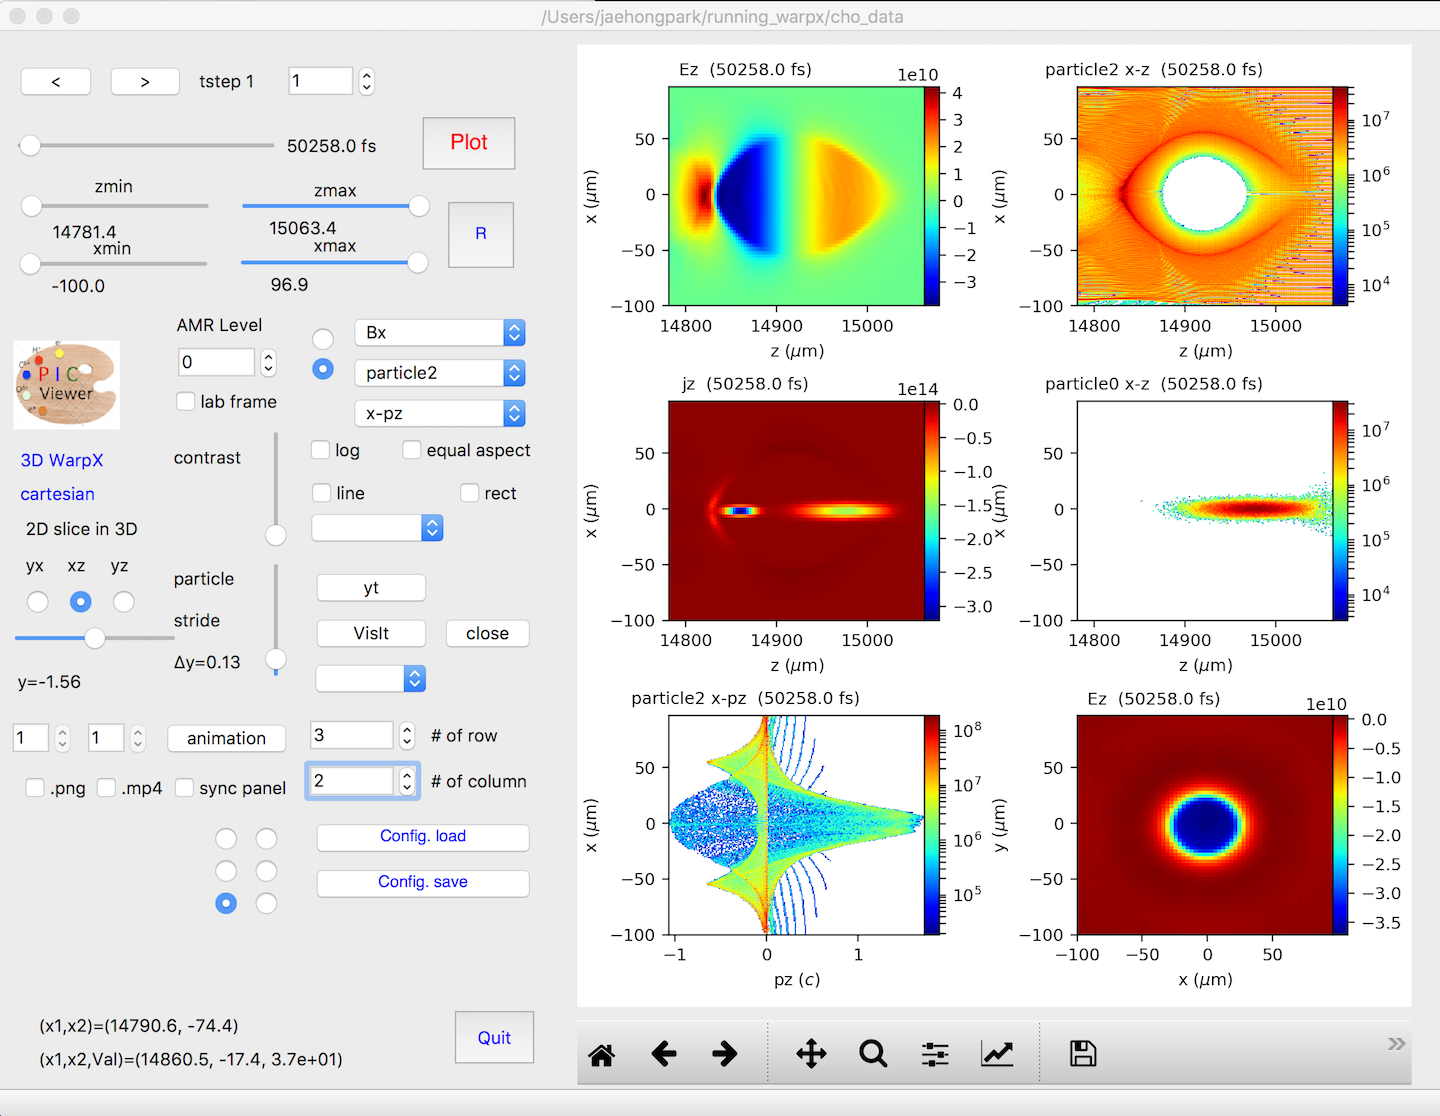
PyQt-based visualization GUI: PICViewer
The toolkit provides various easy-to-use functions for data analysis of Warp/WarpX simulations.
Main features
- 2D/3D openPMD or WarpX data visualization,
- Multi-plot panels (up to 6 rows x 5 columns) which can be controlled independently or synchronously
- Interactive mouse functions (panel selection, image zoom-in, local data selection, etc)
- Animation from a single or multiple panel(s)
- Saving your job configuration and loading it later
- Interface to use VisIt, yt, or mayavi for 3D volume rendering (currently updating)
Required software
python 2.7 or higher: http://docs.continuum.io/anaconda/install.
PyQt5
conda install pyqt
h5py
matplotlib
numpy
yt
pip install git+https://github.com/yt-project/yt.git --user
numba
Installation
pip install picviewer
You need to install yt and PySide separately.
You can install from the source for the latest update,
pip install git+https://bitbucket.org/ecp_warpx/picviewer/
To install manually
Clone this repository
git clone https://bitbucket.org/ecp_warpx/picviewer/
Switch to the cloned directory with cd picviewer and type python setup.py install
To run
- You can start PICViewer from any directory. Type picviewer in the command line. Select a folder where your data files are located.
- You can directly open your data. Move on to a folder where your data files ae located (cd [your data folder]) and type picviewer in the command line.