PICViewer

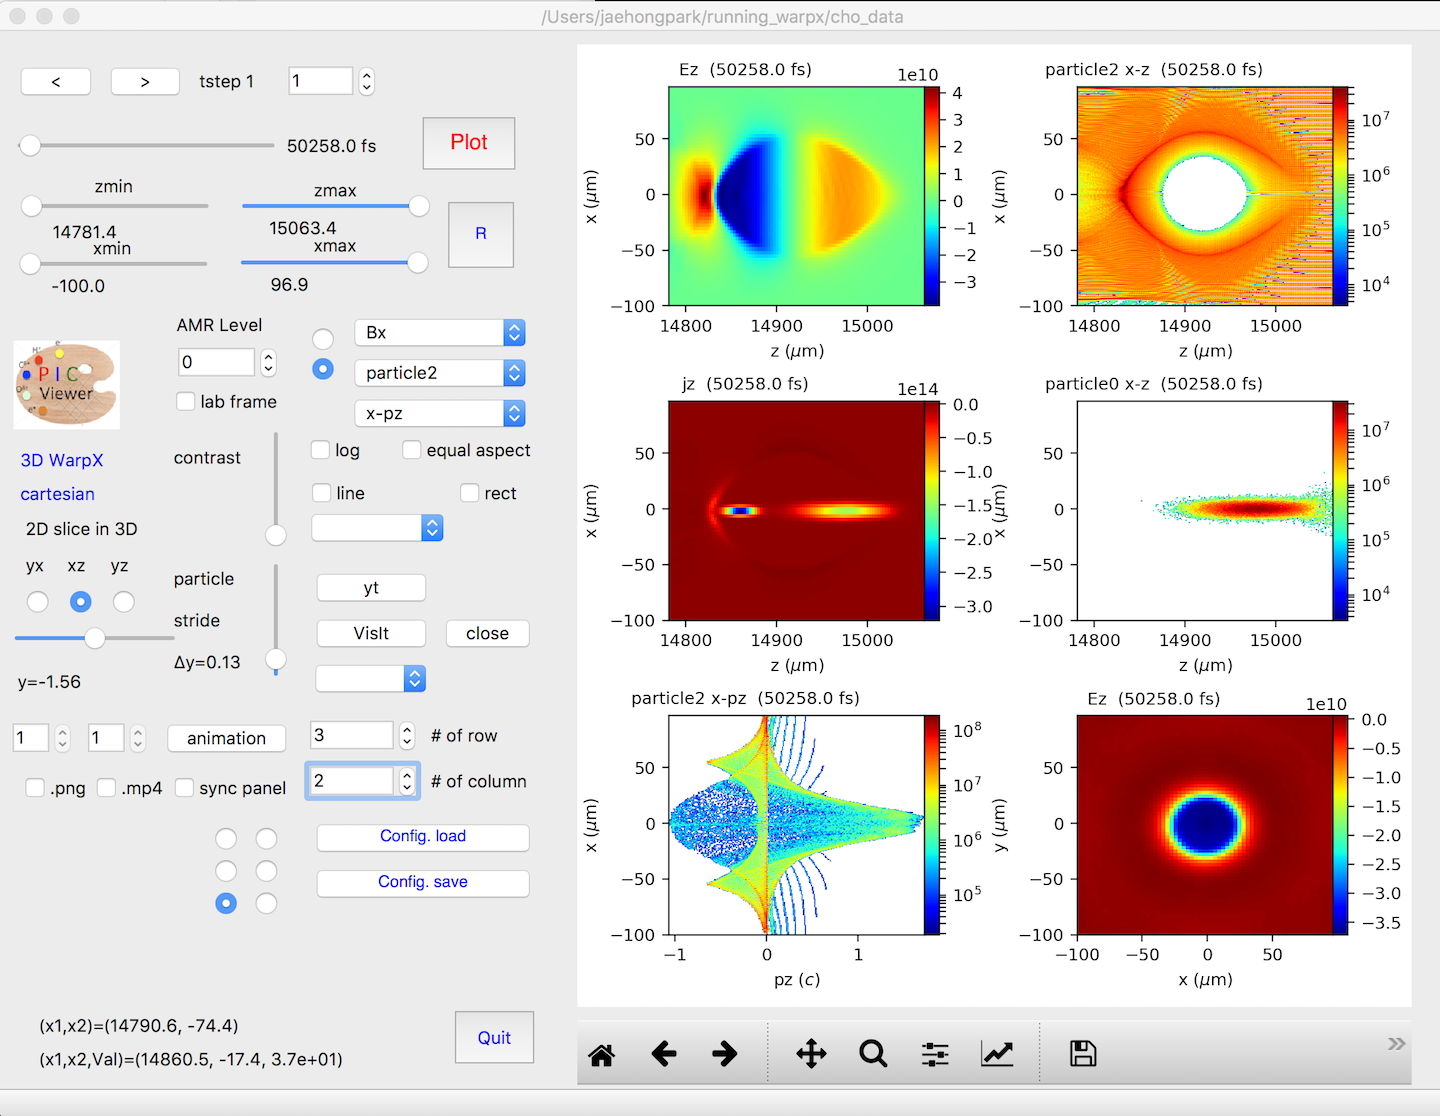
PICViewer is a visualization GUI implemented on PyQt. The toolkit provides various easy-to-use functions for data analysis of Warp/WarpX simulations.
It works for both plotfiles and openPMD files.
Main features
2D/3D openPMD or WarpX data visualization,
Multi-plot panels (up to 6 rows x 5 columns) which can be controlled independently or synchronously
Interactive mouse functions (panel selection, image zoom-in, local data selection, etc)
Animation from a single or multiple panel(s)
Saving your job configuration and loading it later
Interface to use VisIt, yt, or mayavi for 3D volume rendering (currently updating)
Required software
python 2.7 or higher: http://docs.continuum.io/anaconda/install.
PyQt5
conda install pyqt
h5py
matplotlib
numpy
yt
python3 -m pip install git+https://github.com/yt-project/yt.git --user
numba
Installation
python3 -m pip install picviewer
You need to install yt and PySide separately.
You can install from the source for the latest update,
python3 -m pip install git+https://bitbucket.org/ecp_warpx/picviewer/
To install manually
Clone this repository
git clone https://bitbucket.org/ecp_warpx/picviewer/
Switch to the cloned directory with cd picviewer and type python setup.py install
To run
You can start PICViewer from any directory. Type picviewer in the command line. Select a folder where your data files are located.
You can directly open your data. Move on to a folder where your data files ae located (cd [your data folder]) and type picviewer in the command line.
Note
We currently seek a new maintainer for PICViewer. Please contact us if you are interested.